Invisible Patterns of Energy Flow
Have you interacted with a user interface today? The answer is yes, as you would be reading this article on a device and that required an interaction and energy input by you. Do you know how much energy was used in the transaction of that user interaction?
Okay, here’s an easier one - have you eaten some fruit today - banana, apple? Do you know how much energy went into the production of that piece of fruit?
I’ll be talking about Permaculture Design Systems for a Digital Landscape at Web Directions Summit ‘23 and these questions will open the discussion around the invisible patterns of energy flow through design systems and their components.
It all kicks off with a discussion about how Permaculture has a lot of overlaps with Digital Design Systems. Read my previous article An introduction to Permaculture Design Systems for a Digital Landscape to get an idea about the Permaculture side.
Now let’s talk about energy.
More than just electricity

While a lot of focus is generally on the electrical energy side of things, it’s the unseen energies that I want to focus on.
When you stop and look at the connectedness of system elements and ponder for a moment, whether a website or app is even functioning if there is no user to experience it? Like “If a tree falls in a forest and no one is around to hear it, does it make a sound?“.
We assume that the app is running as there is an electricity bill, uptime reports and scheduled processes to prove it, but the real life and function of the app is in the users interacting with it, consuming the content and outputting further actions based on the content consumed.
It is this pattern of energy flow through components and across the system, where things really begin to get interesting. I’ll give you a quick example.
User Interface Transaction
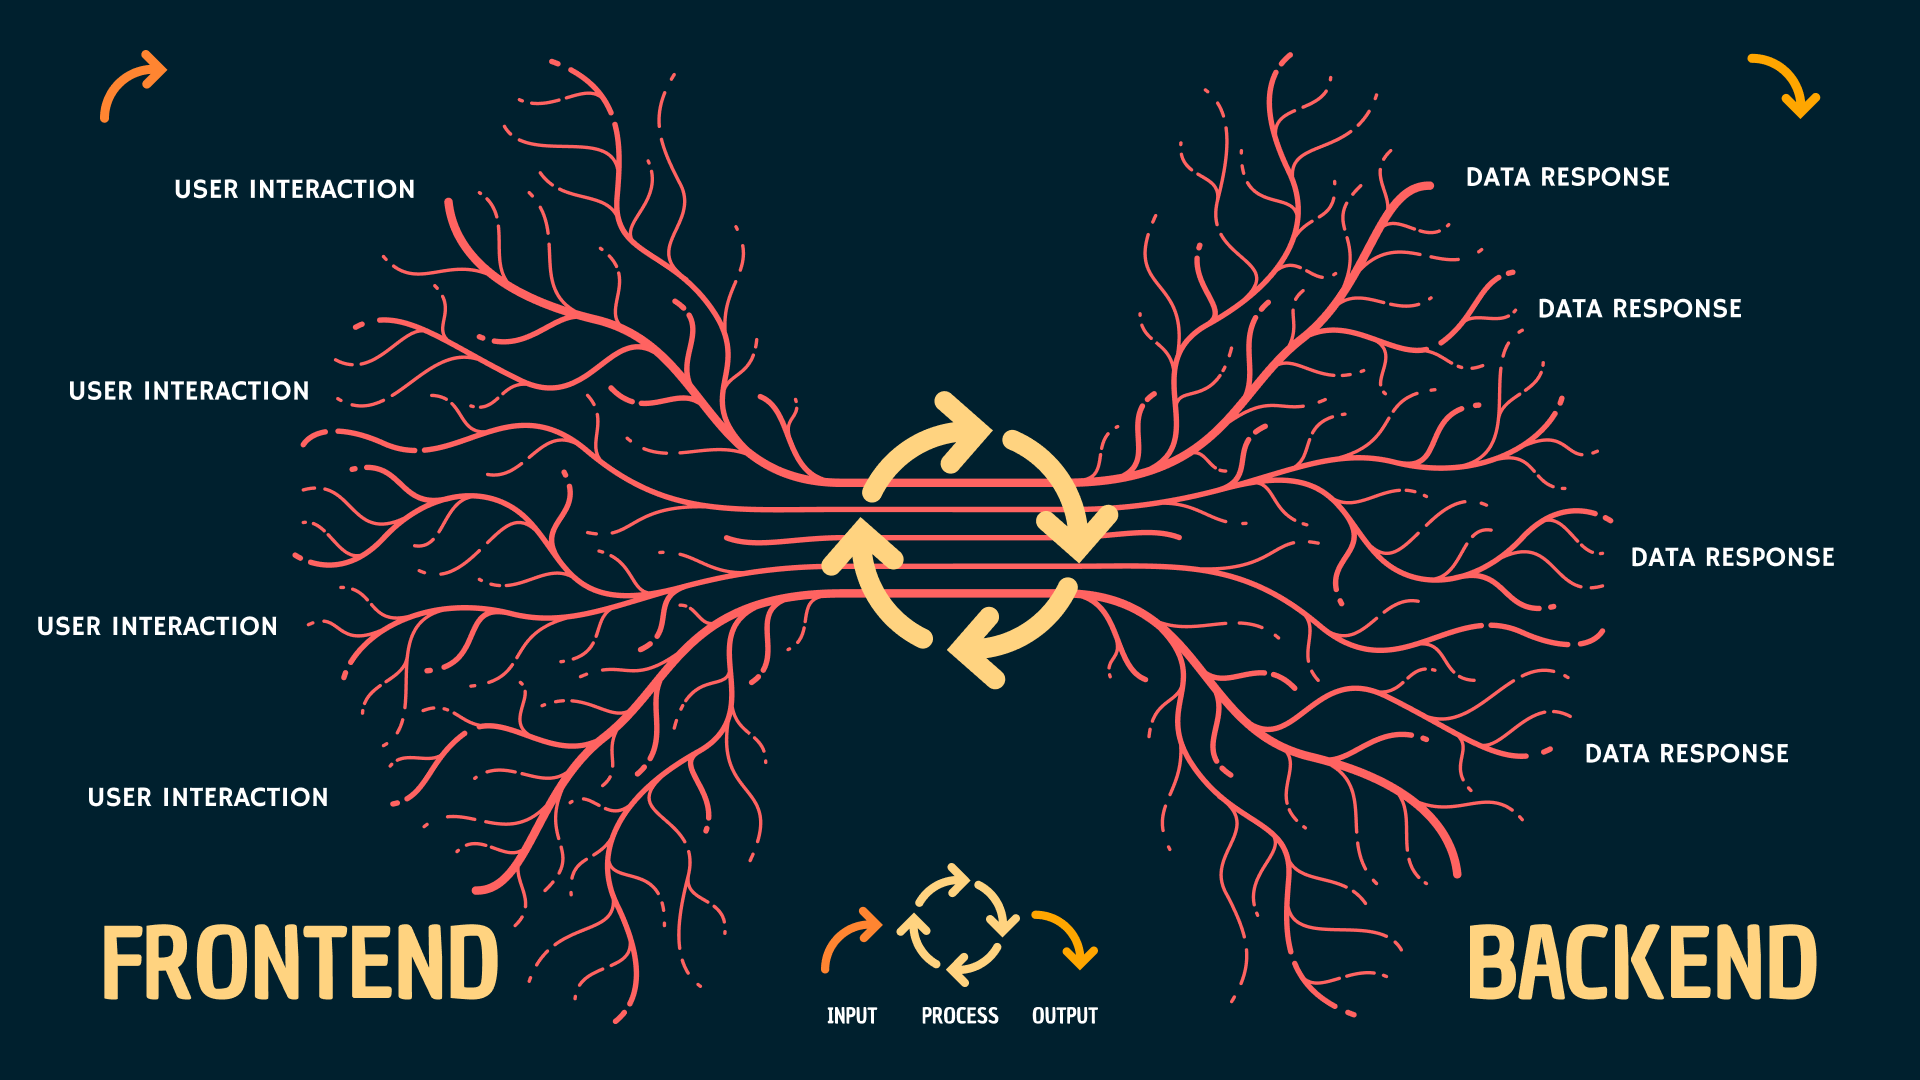
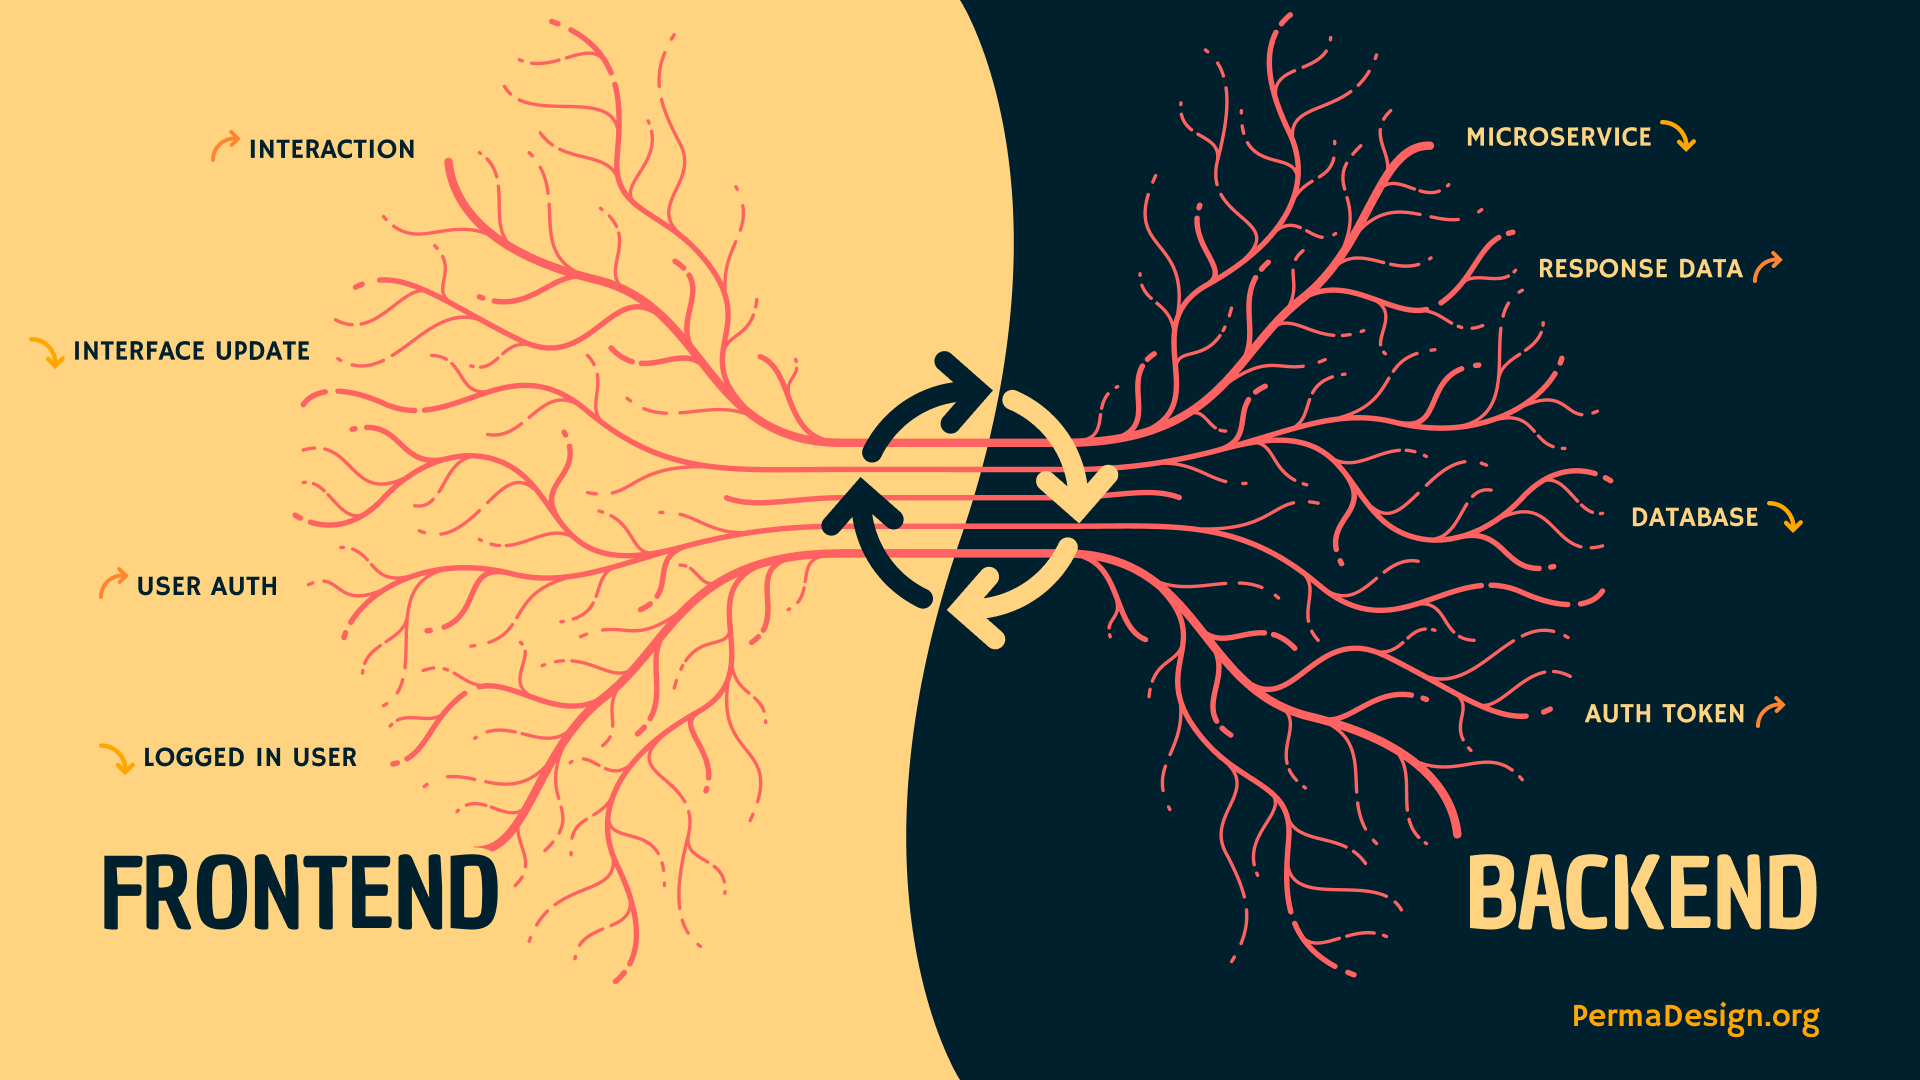
So if you think about a simple user interface transaction from the interaction through the frontend to backend and back to front where feedback is represented in some form, usually a UI update.
The energy from the user interaction flows through the front end framework generating an API request which the backend framework picks up and sends to microservices and other connected services which pull from a database layer for data processing and business logic where a response is generated and sent via HTTP back to the frontend for rendering the user interface feedback.
Here’s the order of events:
- User Interaction
- Front-End Framework
- API Request
- Backend Framework
- Microservices
- Connected Services
- Database Layer
- Data Processing and Business Logic
- Response Generation
- HTTP Response
- Front-End Rendering
- User Interface Feedback
If you visualise this, you would get this neural network looking map of all the things that fired off behind the interface.
Photosynthesis Transaction
Now if you rotate that picture, standing it vertically and rather than front to back, canopy to roots, you can see a very different looking picture, but the functionality is almost identical.
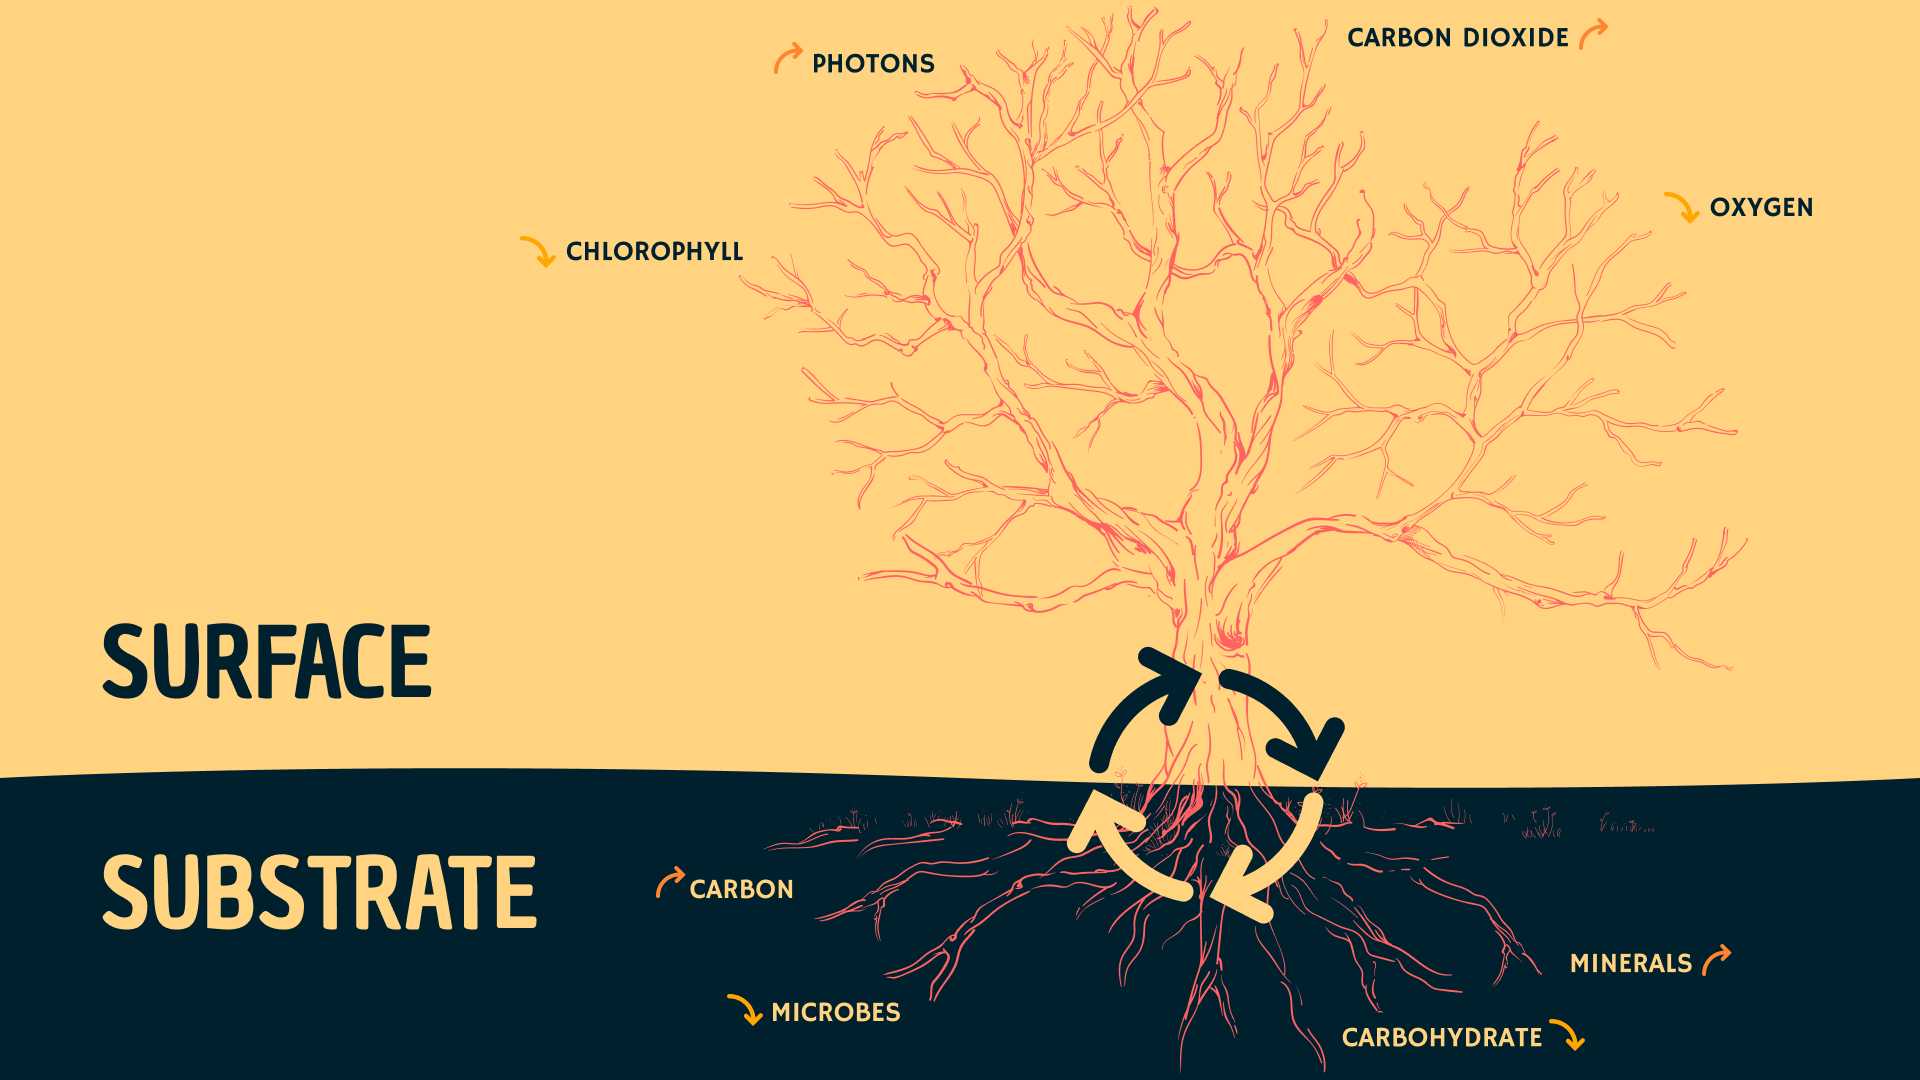
For this example, consider the user input energy being the sun’s input of photons starting the interaction, tapping the interface layer of the leaves, triggering a request via the frontend framework of the branches, validating and sanitising the input, converting it to carbohydrate before sending a request for mineral data down the asynchronous trunk of dark fibre network to the backend framework in the subterranean layer where it connects through the roots to the microservices in the form of microbiology, where they exchange the user request energy for mineral data. Returning the data back through the business logic layer through the roots before preparing the response, travelling back to the frontend branches which mutate the response data and deliver it through the interface layer of leaves where it indicates a successful response in the form of chlorophyll.
Environmental factors and season will indicate which components to use for rendering the interface and the system contains a well defined set of atomic components for the interface in the form of leaves, flowers and fruit which come in adaptive groupings forming molecular arrangements of the atomic design system. It even has a dark mode for display at night.
The patterns of energy that catalyse and support energy flow through a system, activating function along the way and producing forms of natural design that provide an interface to a seemingly invisible transaction of energy. Present in abundance in both natural and digital systems.
What about the energy usage?
So you may be wondering what the actual heck the amount of energy used in the transaction of a user interaction is? Maybe you are thinking about bananas?
Well the answer to these is not very simple and I needed to bring in the big guns to assist in working out what that picture would even look like… Thanks to ChatGPT and some creative questions, I was able to get a rough enough idea to give a bit of an answer to those questions.
In order to get the answers though, it would require a LOT of work.
Mick
Holistically measuring energy input and usage when a user interacts with a button user interface element.
ChatGPT
Holistically measuring energy input and usage when a user interacts with a button user interface element involves considering both the energy consumed by the device or system and the energy expended by the user. Here’s a comprehensive approach to measuring and understanding energy usage in this context:
- Device Energy Consumption:
- Hardware Profiling: Use hardware profiling tools or software to measure the energy consumption of the device during different types of interactions. This may involve monitoring CPU usage, GPU activity, memory utilization, and more.
- Power Monitoring Equipment: Employ specialized power monitoring equipment to measure the energy consumption of the entire device or specific components. This could include current and voltage measurement tools like power meters, oscilloscopes, or energy monitoring ICs.
- Energy Profiling Software: Utilize energy profiling software that provides insights into energy usage patterns. Some platforms offer APIs that allow you to access energy consumption data programmatically.
- User Interaction Energy Expenditure:
- User Studies: Conduct user studies to measure physiological factors like heart rate, body movement, and muscle activity during button interactions. These factors can help estimate the energy expended by the user.
- Biometric Sensors: Integrate wearable devices or biometric sensors to monitor vital signs like heart rate and calorie burn. These sensors can provide data on the energy expended by the user during interactions.
- Data Integration and Analysis:
- Synchronization: Ensure that data from both device energy consumption and user energy expenditure are synchronized. This might involve timestamping data to correlate device activity with user interactions.
- Data Analysis Tools: Use data analysis tools and techniques to correlate device energy usage patterns with user interaction patterns. This could involve visualizing data to identify trends and insights.
- Normalization and Comparison:
- Benchmarking: Establish benchmarks for typical energy consumption during button interactions. This can help identify anomalies or unusually high energy usage instances.
- Normalization: Normalize energy consumption values to a common unit, such as watt-hours (Wh) or joules (J), to facilitate meaningful comparisons.
- Feedback and Optimization:
- User Feedback: Gather feedback from users about their perception of energy consumption during interactions. This can provide qualitative insights that complement quantitative measurements.
- Optimization Strategies: Use the insights gained from the measurements to identify opportunities for energy optimization. This could involve improving the efficiency of the device, minimizing unnecessary animations, or optimizing user interaction patterns.
- Communication and Transparency:
- User Education: Educate users about the energy implications of their interactions. Transparently inform them about the energy impact of different actions, enabling more conscious choices.
- Visual Indicators: Implement visual indicators that show users the energy impact of their actions in real-time. For instance, using color changes or animations to represent higher energy consumption.
Remember that measuring energy usage holistically requires collaboration between user experience designers, hardware engineers, software developers, and possibly experts in ergonomics and physiology. It’s also important to consider the ethical implications of gathering user biometric data and to ensure compliance with relevant privacy regulations.
🫠
Mick
Estimating the average energy input and usage resulting from a user clicking a button and receiving a rendered response on the screen.
ChatGPT
Estimating the average energy input and usage resulting from a user clicking a button and receiving a rendered response on the screen can be quite complex, as it depends on various factors including the device’s hardware, software efficiency, screen technology, and user behavior. Here’s a rough breakdown of the energy usage components:
- User Input Energy:
- Button Click: The physical act of clicking a button requires a small amount of energy. This is typically negligible compared to other factors.
- Device Energy Consumption:
- CPU Usage: The energy consumption will increase when the device’s CPU processes the user’s click event and executes the necessary code to handle the interaction.
- GPU Usage: If the response involves rendering graphics, animations, or complex visuals, the GPU will consume additional energy.
- Display Energy: Displaying the response on the screen consumes a significant amount of energy, especially on devices with bright and high-resolution screens. The type of display technology (LCD, OLED, etc.) also affects energy usage.
- Network Communication:
- Data Transmission: If the user’s click triggers a network request (e.g., fetching data from a server), energy will be consumed during data transmission over the network.
- Software Efficiency:
- Code Efficiency: The efficiency of the software code that handles the interaction and response affects energy usage. Well-optimized code can reduce unnecessary computations and lower energy consumption.
- User Behavior:
- Frequency: The number of times users interact with buttons and receive responses impacts the overall energy usage. More interactions result in higher energy consumption.
- Duration: The time users spend interacting with the response also affects energy usage. Longer interactions consume more energy.
It’s challenging to provide an accurate estimate without specific device and usage context, but to give you a rough idea:
- Button Click Energy: Negligible.
- CPU and GPU Usage: A single button click and response rendering might range from a few millijoules (mJ) to tens of millijoules.
- Display Energy: This is typically the largest energy consumer. A single screen refresh for rendering the response might consume anywhere from 100 millijoules to a few joules, depending on the screen size and technology.
- Network Communication: The energy consumed during network communication can vary widely, but a single network request could range from a few millijoules to tens of millijoules.
Keep in mind that these estimates are very rough and can vary significantly based on device specifications, screen technology, software optimization, and user behavior. To get a more accurate estimate for a specific scenario, you might need to use energy profiling tools, monitor the device’s energy consumption during interactions, and analyze the data collected.
🤔
So I will just do an estimate
Getting the exact answer is nontrivial and I won’t go too far down that path alone. Happy to speak to anyone interested in actually conducting this test though. 😃
I asked a couple more questions to get an estimate. These are fairly rough estimates as a result, but worth noting. Adding the interaction for growing a banana for comparison:
- User interaction transaction: 522 millijoules
- Growing a banana: 1,068 kcal = ??? millijoules
So even though I can’t really comprehend these numbers as they are, it is clear there is more energy in the production of a banana than in a user interaction and completed transaction. There are of course a heap of differences here, the input energy is different, the processing energy is seemingly free and there is an element of scale, as we don’t generally grow to 5 meters and usually only have two hands. Banana trees also go into end of life cycle once they have provided fruitful feedback, thankfully our digital culture is a bit more permanent than that.
So how do we look at these energy flows and see them as patterns to work with in our design systems?
Energy
We have prototype flows that we already use to indicate the pathways through experience and so we can use a similar approach to visualise energy flows that are the series of functional events that take place only after a user interaction has taken place.
How energy flows through the system
As with the opening example of the tree performing a web request and response, the way that energy flows through the system is from many different points of origin, however as it flows through the inputs, processes and outputs of each element in the system, the form or flow of energy can change.
Each element is like a logic gate that determines whether energy will pass through it or be terminated by it and what the process leading to that conclusion is.
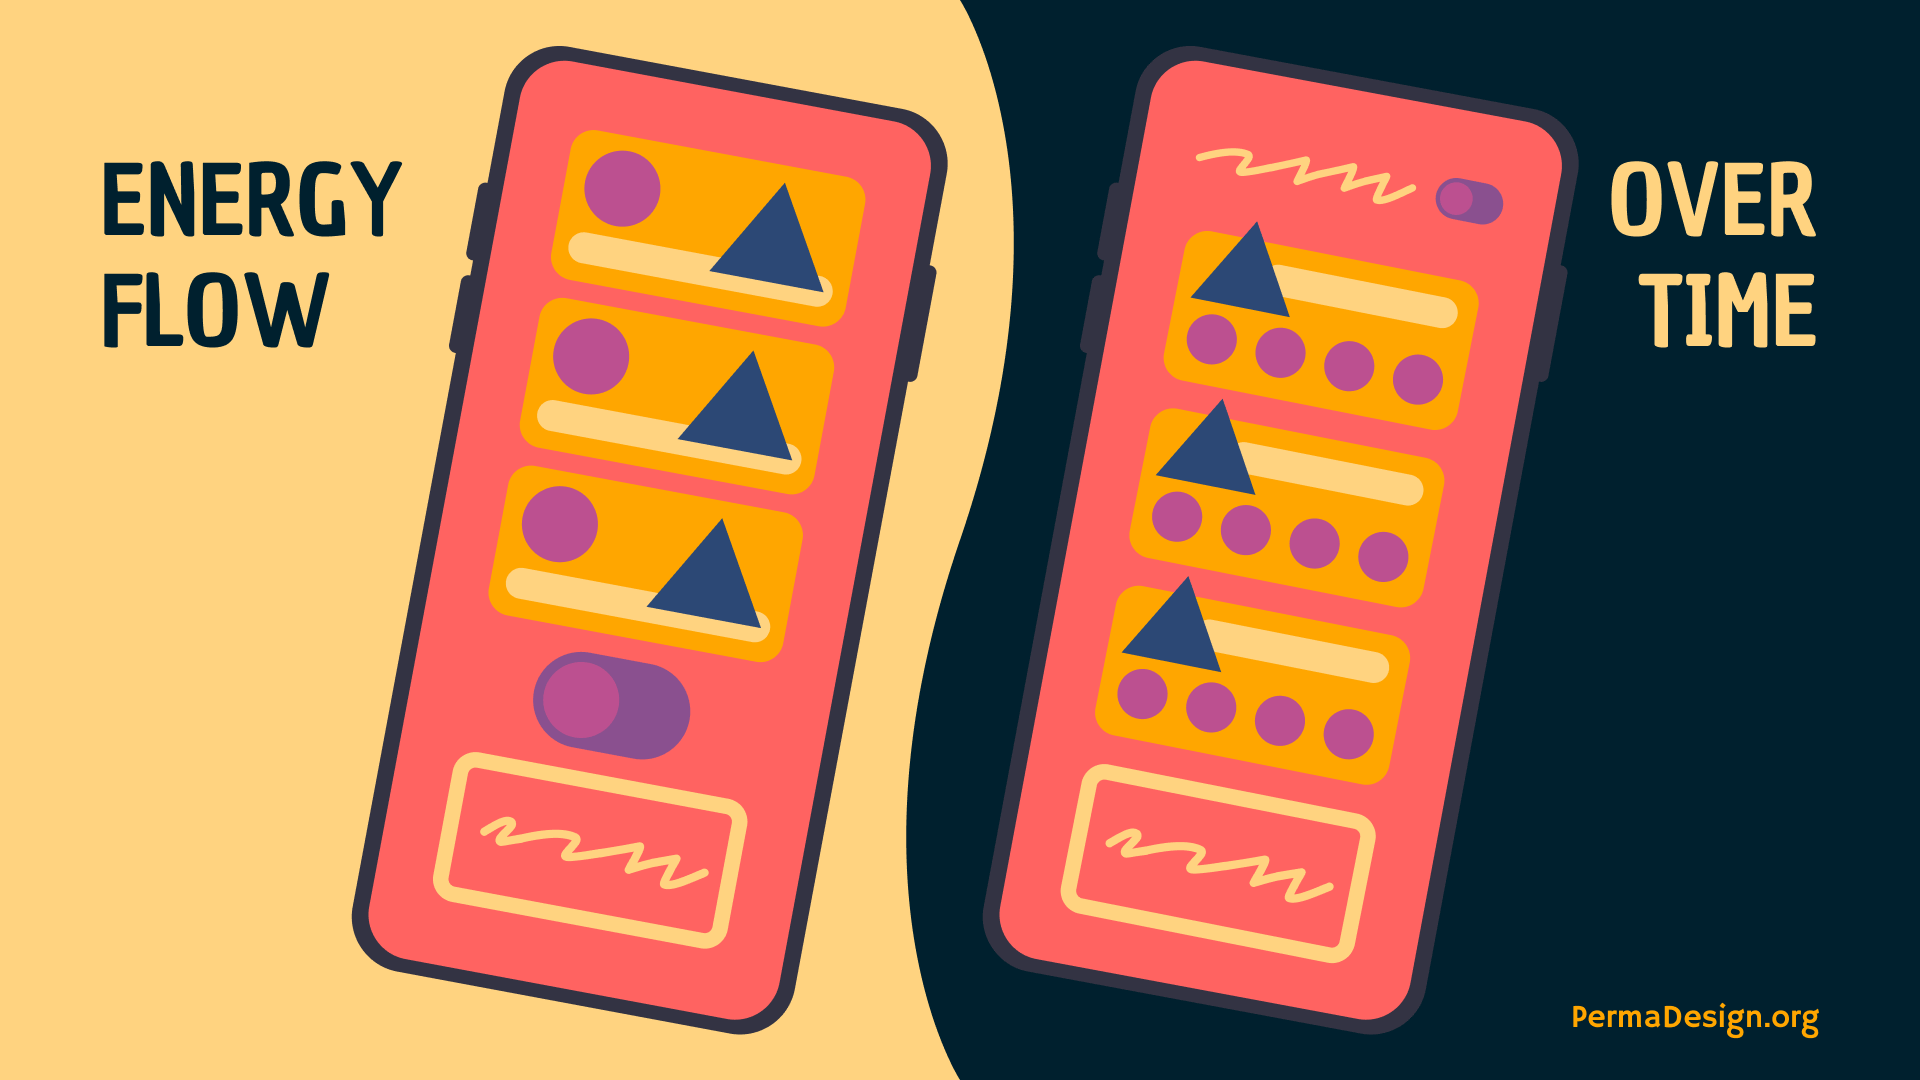
How energy changes over time
As more energy flows through components, the functional requirements may change. This can be due to requirements reflected as parameters of the environment or as natural evolution due to the evolving interactions and connections with surrounding and accommodating elements.
Energy States
Input Output
Energy has various forms and can change during process. By identifying what the energy form is at the different modes of energy flow, it could give a different view of what potential energies are available outside the obvious.
As an example, an input button has potential energy as it can trigger another element and a flow of energy through a system, but not without the user input energy which is in kinetic form. There are other elements near the button that may change as the button is activated, in a sort of nuclear type reaction.
The source of input energy then plays a role in what available forms go into each element. In the case of an interface, the source of an input could be from an endpoint - as a user interaction or start of a response, or from energy output by another element in the flow.
Outputs become inputs and have the potential to provide a continuation of energy flow, catalysing function along the way.
Process
In order to create efficiencies in a system of energy flow, it makes sense to optimise inputs and process, handing over something ready to output, so that output is concerned with delivering a succinct yet adequately charged energy as input for the next node in the chain.
The input energy that has then been optimised for its process does something to that energy, this is the function of that atomic element. It can contain the blueprint for that atom’s success, much in the same way a seed holds the entire genetic structure for it to grow into an emergent 30 meter tree bearing fruit and reproducing via its own seed. So what functionality is responsible for the process of each element?
In this functionality there could be many things going on, though a couple to consider are whether the process is responsible for rationalising the input or just passing it on with minimal modification.
Elemental Companionship
Considering these energy flows and how things interact, some things play nicer together than others do and identifying these interactions should be a core part of putting together functional components in a design system. Looking beyond how things interact now and when shipped, how do interactions evolve?
In a future article I’d like to share thoughts about Atomic Taxis and Nuclear Relationships and how we as creators can look at designing for evolution of elements and their relationships.